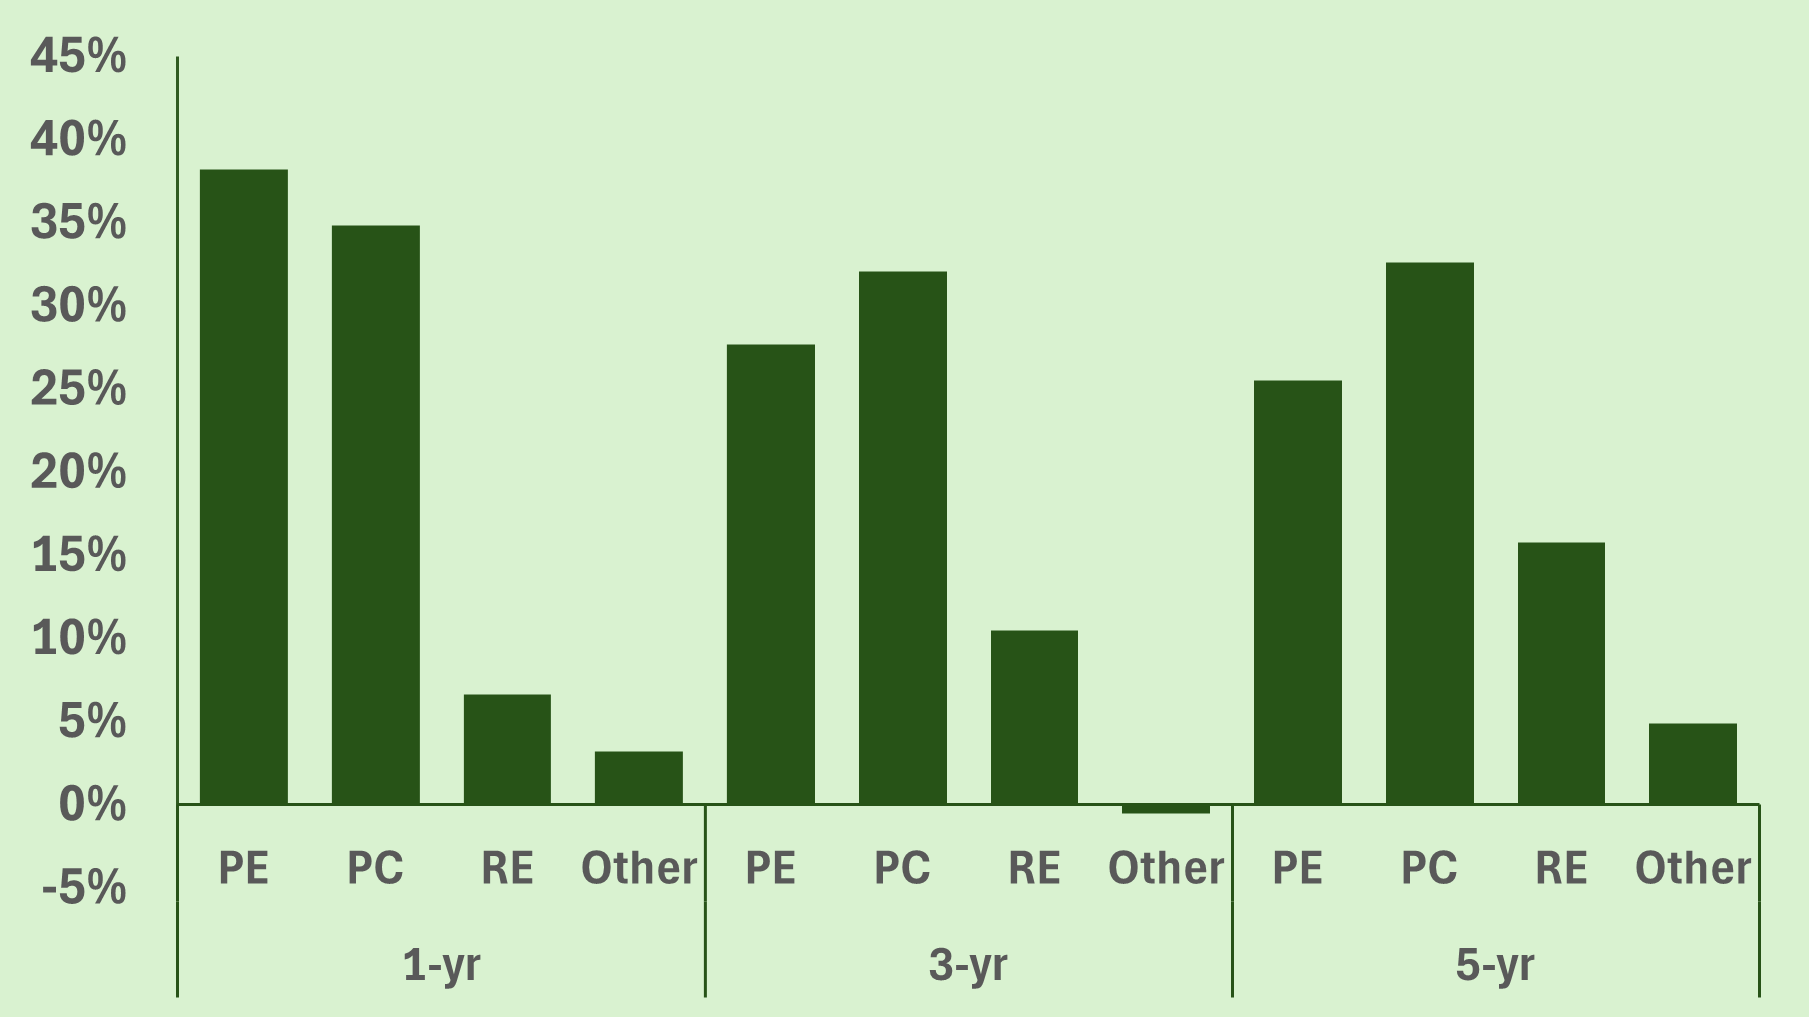
Private Equity and Private Credit have grown much more rapidly than Real Estate and Hedge Funds / Other over the last five years (30%+ annually for PE & PC vs <20% for RE & HF).
Private Equity Evergreens have grown NAV at a 45% annual rate over the last five years, or 6.4x from 1Q20, and reaccelerated to 56% in 1Q25 TTM. Private Equity total returns have been highest among asset classes.
Private Credit’s 5-year growth has been almost as strong (41%), with a notable peak of 81% in 1Q22 TTM. Its latest TTM growth of 42% was slightly above the 5-year average. Private Credit returns have ranged 9-12% for the last two years.
Real Estate’s average annual growth of 21% has had the most variability, peaking (similar to Private Credit) at 80% in 1Q22 TTM but nearly flattening to 1% in 1Q24 TTM. Real Estate NAV has increased 2.5x in the last five years, but its growth was the lowest among asset classes in 1Q25 TTM, at 8%. Real Estate returns recovered to +7% in 1Q25 TTM.
The Hedge Fund / Other category has also been variable, and the peak occurred earlier (51% in 1Q20 TTM). The category suffered aggregate NAV declines over the two years after the peak, but has stabilized to 15-16% over the last two years. This category had relatively strong total returns of +14% in 1Q24 TTM, but eased to +6% last year.
NAV Growth by Asset Class
Annualized Flows ($B) by Asset Class

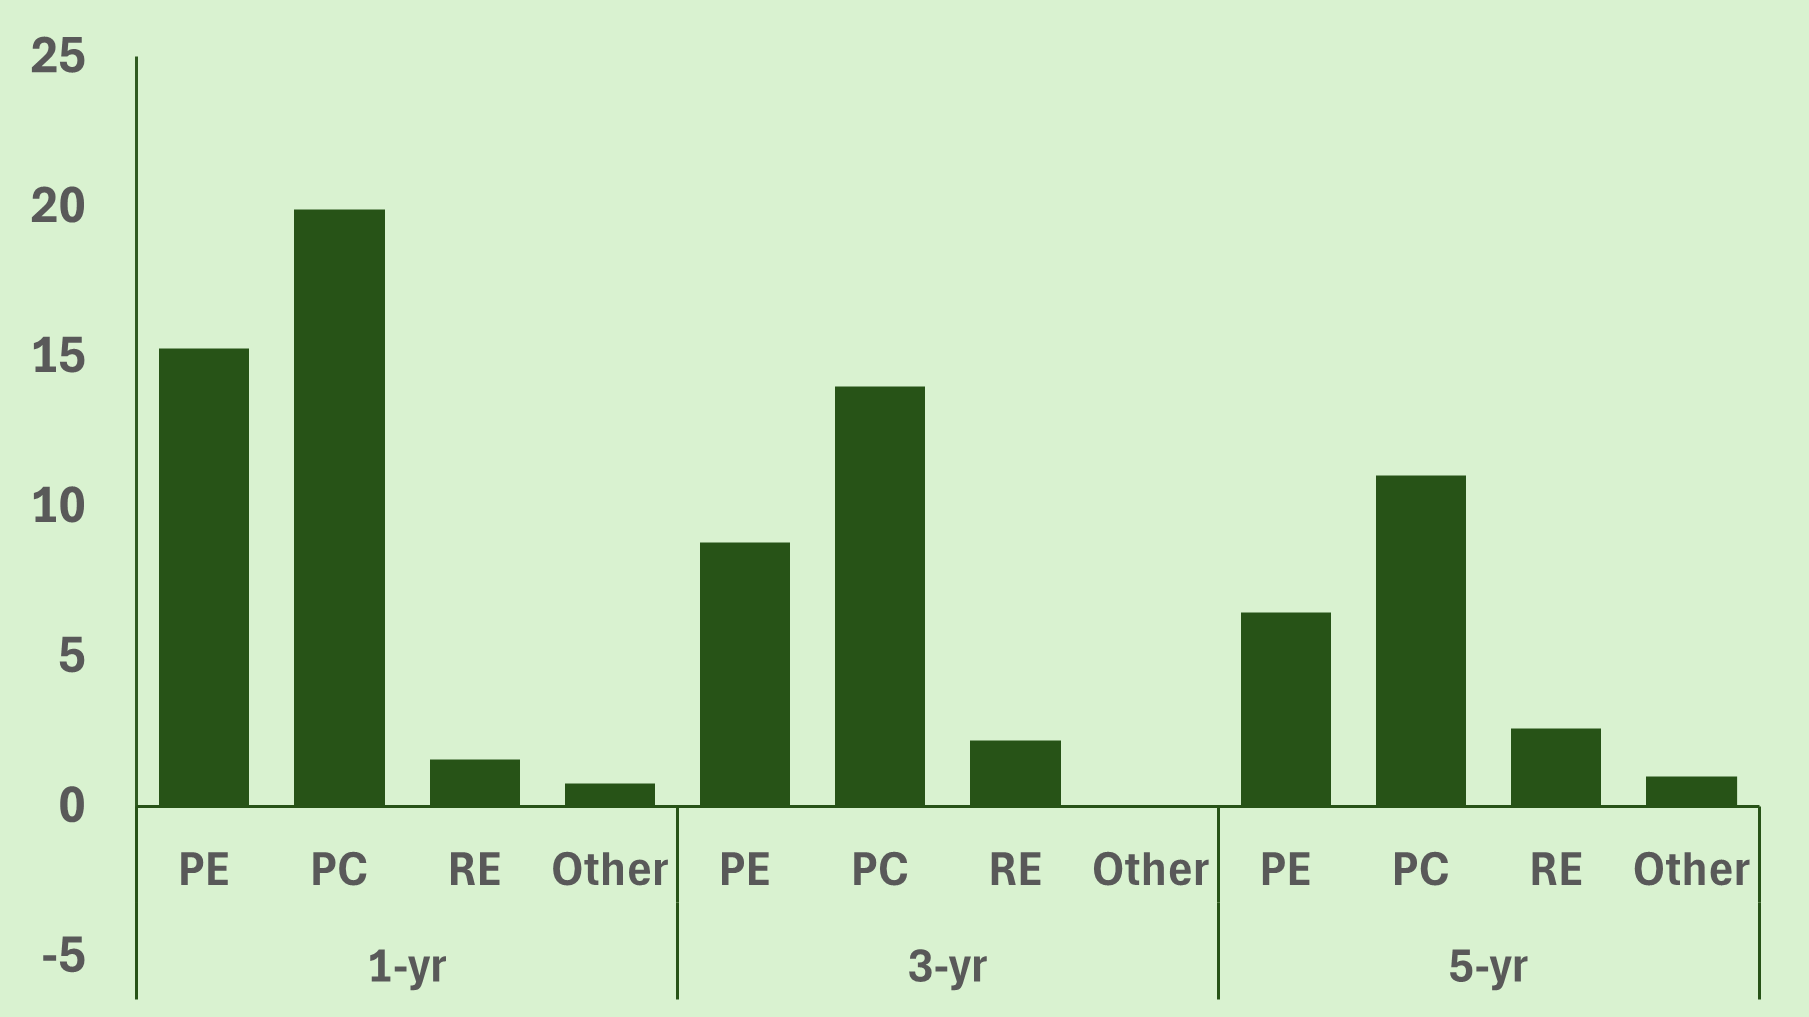
The differential in Annualized Organic between Private Equity and Private Credit (strong) and Real Estate and Other (moderate at best) has continued to widen over the past year.
While total returns have converged somewhat, this growth differential has widened over the past year. Total Returns for all asset classes dipped (-4% to +4%) in 1Q23 TTM.
Annualized Organic Growth by Asset Class
Annualized Total Return by Asset Class